News Summary
A recent study reveals that Manhattan has the highest driving incident rate in New York City, with 7.8 accidents per 1,000 drivers. In contrast, the Bronx boasts the lowest incident rate at four accidents per 1,000 drivers. Brooklyn faces the highest car insurance rates at $5,748 annually, while Manhattan offers the lowest insurance at $3,628 despite its poor driving record. This complex landscape highlights the unique challenges and costs associated with driving in different NYC boroughs.
Manhattan Dethroned: Worst Driving Record in New York City!
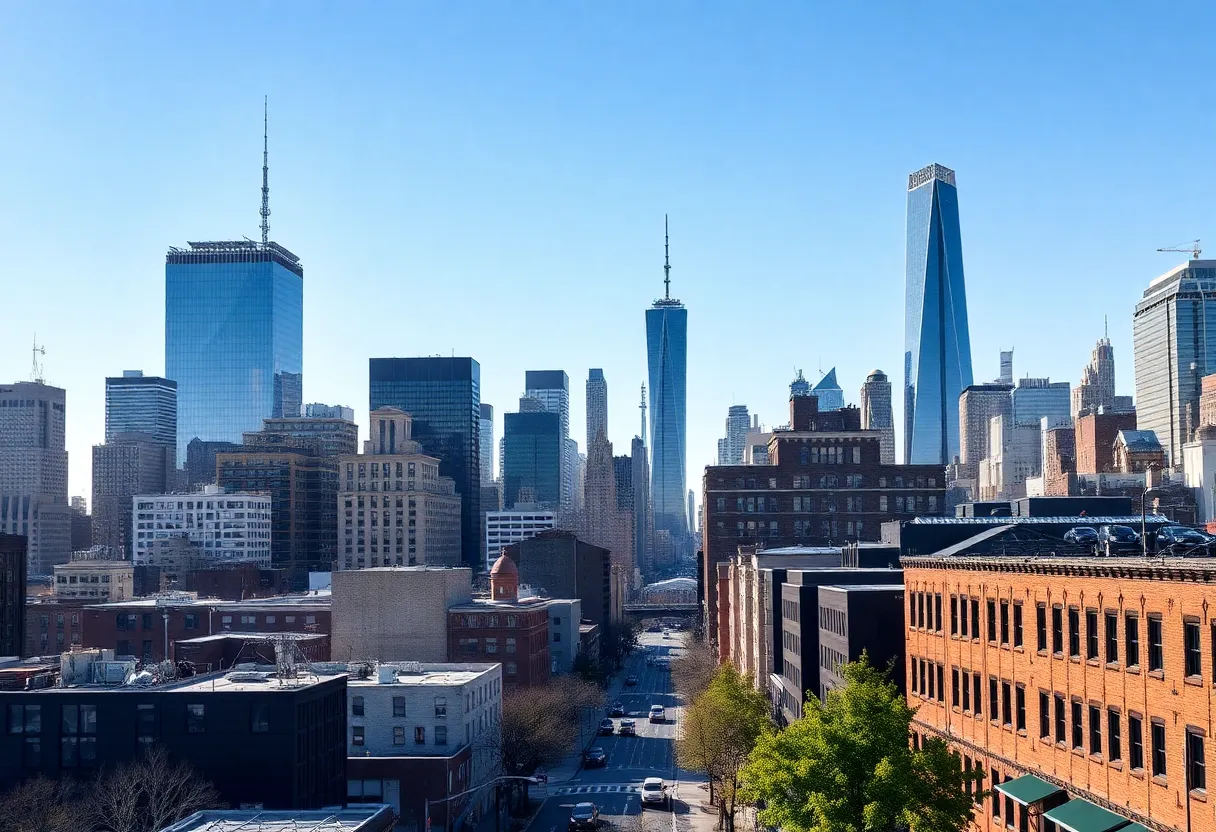
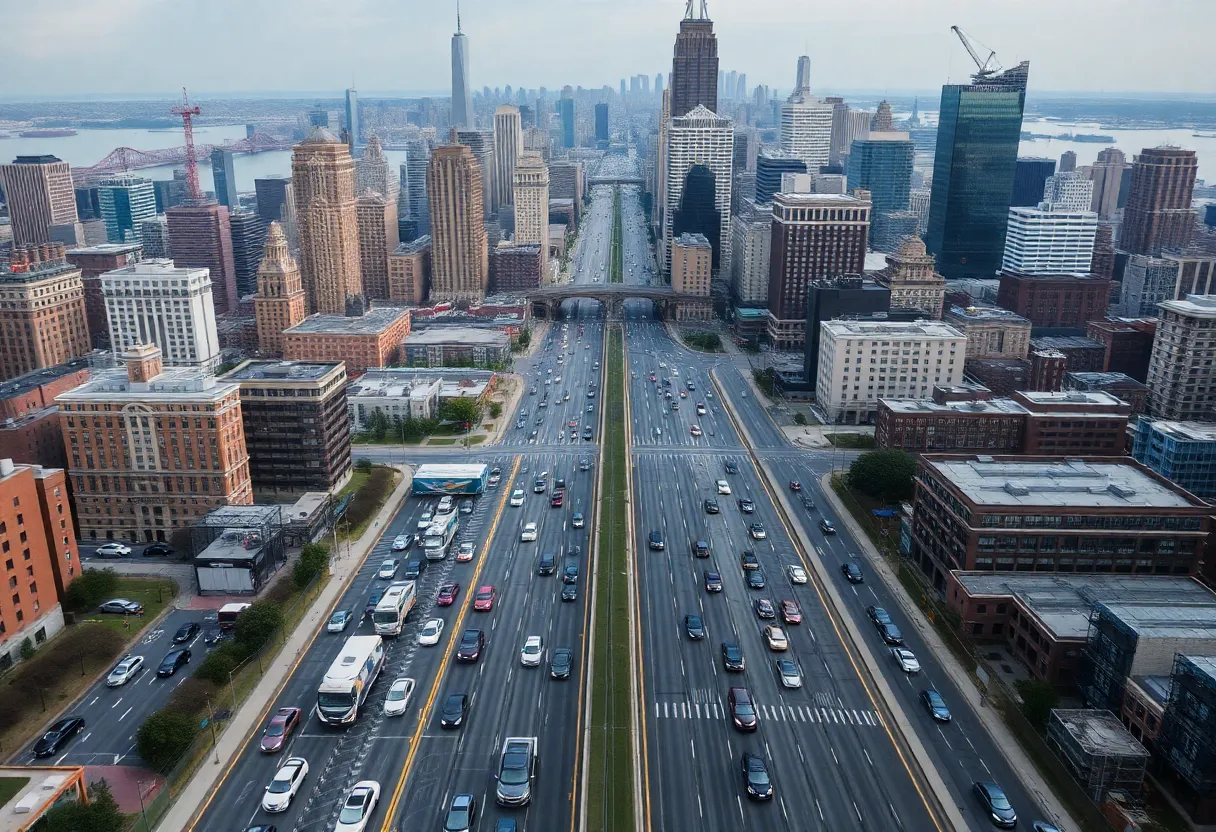
Welcome to the bustling streets of New York City, where the subway is always an option, but many drivers still choose to hit the road. However, according to a recent study by LendingTree, it turns out that not all drivers are created equal. In fact, Manhattan has been crowned the king of accidents, boasting a staggering 7.8 driving incidents per 1,000 drivers! Can you believe it?
The Bronx: A Surprise Champion
On the flip side of the coin, if you’re searching for the best driving record in the city, look no further than the Bronx. With only four incidents per 1,000 drivers, they are the unsung heroes of the road. It’s fascinating to see how neighborhoods differ, isn’t it? Following Manhattan, the rankings get interesting, with Staten Island, Brooklyn, and Queens also taking their spots in the not-so-great driving record club.
Brooklyn Burden: High Insurance Rates
Now, let’s talk about the not-so-friendly cost of having a vehicle in this urban jungle. Drivers in Brooklyn are feeling the pinch with the highest car insurance rates in the city, averaging a jaw-dropping $5,748 annually. Yes, that’s about $479 per month, which is a hefty price to pay for the privilege of navigating New York City’s often-chaotic streets!
Queens & Insurance Rates
Not too far behind in the insurance rate game is the neighborhood of St. Albans in Queens with a monthly average of around $451. It seems no one is getting off easy when it comes to insuring their vehicles across the boroughs.
Manhattan: The Silver Lining
Interestingly, if you’re driving through the streets of Manhattan, there’s a silver lining. Despite the borough’s reputation for fender benders, drivers there actually enjoy the lowest car insurance rates at an average of $3,628 annually. That’s quite the surprise considering their ranking for driving incidents!
Overall Cost Comparison
On a broader scale, if you average out the monthly car insurance costs across all the boroughs, you’re looking at around $375 a month or $4,500 a year. For those keeping track, that’s nearly double the state average for car insurance in New York. It’s important to point out that even with fewer incidents, Bronx drivers still face high insurance costs, averaging $5,153 a year.
Understanding the Complexities of NYC Driving
This study by LendingTree sheds light on the complicated tapestry of driving in NYC. With increasing traffic congestion and soaring insurance rates, the driving environment can be a challenging one. The methodology used in the study assessed the number of driving incidents specifically in relation to the number of drivers seeking auto insurance, ultimately placing Manhattan at the bottom of the barrel.
Conclusion
So, what’s the takeaway for New York City drivers? Whether you’re maneuvering through Manhattan‘s crowded streets or cruising along the Bronx’s roads, the realities of car insurance and the driving record can be quite an eye-opener. With so many factors at play, understanding your borough’s statistics could save you some serious money in the long run.
Deeper Dive: News & Info About This Topic
HERE Resources
Additional Resources
- PIX11: Manhattan Has the Worst Drivers in All of NYC
- AMNY: Locations of Speed Cameras in NYC
- New York Post: 19-Year-Old Woman Killed in NYC Moped Crash
- New York Times: Vehicle Ramming Attacks
- AP News: New York City Taxi Crash
- Wikipedia: Traffic in New York City
- Google Search: NYC Driving Statistics
- Google Scholar: New York City Driving Incident Study
- Encyclopedia Britannica: Automobile
- Google News: NYC Car Insurance